Charts that answer a question
Decide what question the chart answers, pick the one chart type that answers it, label it so it stands alone.
Start with the question
A chart is a sentence in picture form. Before you insert one, write the sentence: “Sales fell in Q3”, “Store C is our smallest”, “Most spend is on labour”. If you cannot write it, you do not need a chart yet; you need a pivot table.
Match the question to the chart
| Question | Chart | Avoid |
|---|---|---|
| How did something change over time? | Line chart | Pie |
| How do categories compare? | Bar or column chart | Line, pie with more than 5 slices |
| What share of the whole is each part? | Pie (5 slices or fewer) or stacked bar | Pie with 12 slices |
| Do two numbers move together? | Scatter chart | Line |
| How are values spread? | Histogram | Pie |
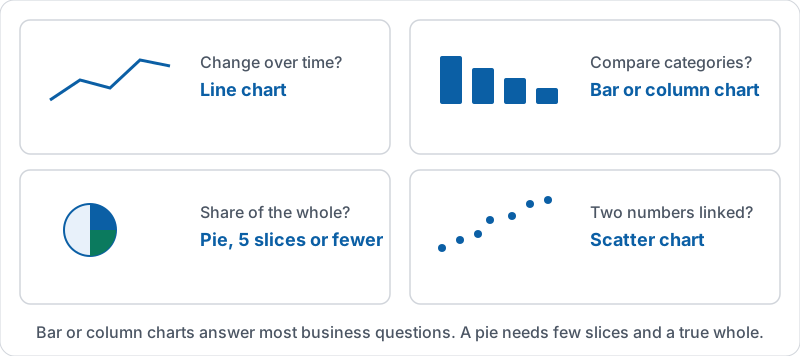
Bar or column charts answer most business questions. A pie chart is only readable with a few slices and when the parts add up to a meaningful whole.
The four questions and their charts.
Make it stand on its own
The chart will be pasted into a doc or a slide and seen without you there to explain it.
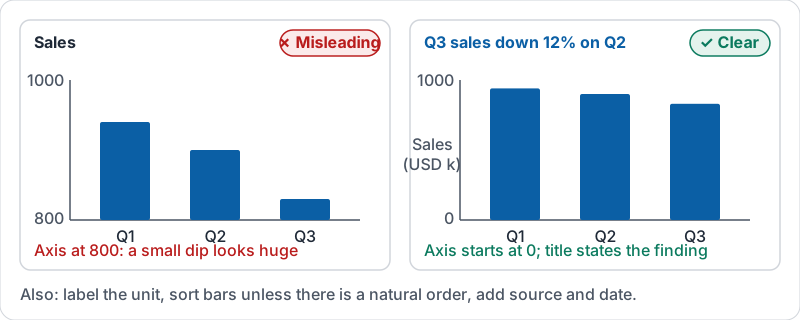
- Title says the finding: “Q3 sales down 12 percent on Q2”, not “Sales”.
- Axis labels name the unit: “Sales (USD)”, “Orders per week”.
- Start the value axis at zero for bar and column charts, or small differences look huge.
- Few colours, and never meaning carried by colour alone. Label the bars.
- Sort bars largest to smallest unless the categories have a natural order (months, sizes).
- Source and date in a note under the chart if it leaves the sheet.
The same three quarters charted twice.
Charts from pivot tables
Build the pivot first (lesson 6), then chart the pivot. The chart then reflects a clean summary, and it updates when the data does. Charting raw rows is how you get a line chart with 400 points nobody can read.
A tour of the chart editor, from inserting a chart to the Setup and Customise tabs.
Try it now
Take the pivot table from lesson 6 (total by region). Write the sentence it shows. Insert a column chart from it, give it that sentence as its title, label the value axis with the unit and make sure it starts at zero.
Remember: question first, then chart type, then a title that states the answer. If the title is just the name of a column, it is not finished.
Checking your progress…